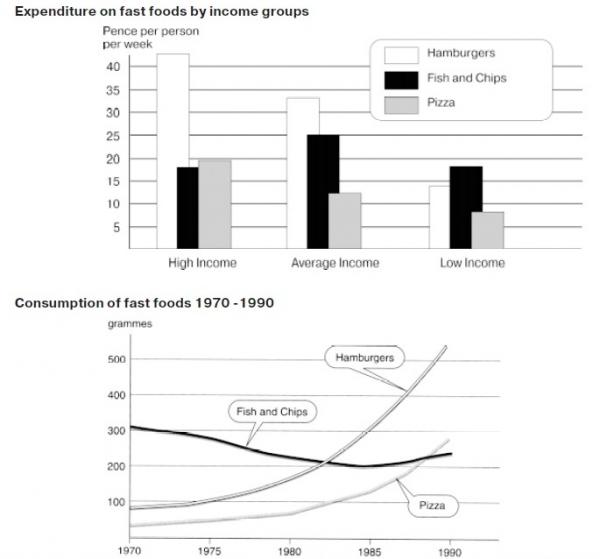
The chart below shows the amount of money per week spent on fast foods in Britain. The graph shows the trends in consumption of fast foods.
Write a report for a university lecturer describing the information shown below.
(You should write at least 150 words.)

ANSWER:
The chart reveals information about how much a British spends on fast foods per week. The graph below informs us of consumption trends in fast foods from 1970 to 1990.
Taking a quick look at the chart, one can see that the statistics are presented according to three types of financial abilities: high income, average income and low income. It is reported that people whose income is high have a preference towards hamburgers: each of them spends over 40 pences on hamburgers on average. Meanwhile, each of this group spends about 19.6 pences and 18 pences only on fish and chips and pizza respectively. The average income group's dominant fasf foods are also hamburgers with a sum of over 30 pences a week per person. However they tend to spend more on fish and chips than the high income group since the expenditure of each week per person is 25 pences. Both average and low income group spend least on pizza: 13 pences for a person of average income group and 8 pences for one of the low income group. For the low income group, expenditure on hamburgers and fish and chips is about 14 and 18 pences.
Move on to the graph, onw can easily notice there was a difference among the consumption of hamburgers, fish and chips and pizza. The consumption of hamburgers grew the most rapidly of all from 1970 to 1990. There was a stable decline in the consumption of fish and chips until 1985. Since then, the sales of them increased gradually. Pizza saw a sharp growth in consumption from 1980. However, the speed of consumption growth of pizza is not as much as hamburgers'.