[VIP 50k - CHỮA BÀI TỐT, NHẬN TIỀN THẬT - DEADLINE: 10/12] The graph below shows UK acid rain emissions, measured in millions of tones, from four different sectors between 1990 and 2007
closed by
661 views
0 votes
0 votes
closed

CWMP VIP là chuyên mục mới toanh từ Chữa Writing Miễn Phí. Chuyên mục này dành cho các bạn có năng lực chữa bài tốt trên cwmp có thể trao đổi, trau dồi, cũng như kiếm tiền thưởng từ chính năng lực vốn có của mình.

Đối tượng tham gia: Tất cả thành viên trên diễn đàn

Thể lệ chương trình: cwmp sẽ đưa ra các bài viết IELTS bất kỳ, kèm theo deadline chữa bài. Việc của các bạn sẽ là chữa và gửi bài phía dưới. Bài chữa chất lượng nhất, trình bày sạch đẹp nhất và đúng deadline của chương trình sẽ được nhận phần thưởng là TIỀN MẶT từ cwmp (tiền mặt có thể nhận dưới dạng chuyển khoản ngân hàng, MoMo hoặc mã thẻ điện thoại tuỳ chọn)

Đây là hoạt động diễn ra liên tục trên diễn đàn, và chúng mình sẽ ưu tiên các bài viết gửi lên sớm nhất. Vậy nên các bạn hãy cố gắng nhanh tay nhé ^^

Bài 1: Phần thưởng 50.000VNĐ - Deadline: trước 10/12


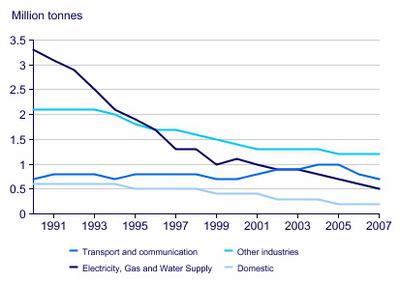
The line graph compares and contrasts data on the changes in the number of acid rain emissions in the UK from four different sectors, measured in millions of tons, over a seventeen-year period from 1991 to 2007.

Overall, what stands out from the graph is that transport and communication maintained the same level in the number of acid rain emissions over seventeen years, while other sectors saw a significant fall, especially Electricity, Gas and Water supply. Among the four sectors, other industries have the lowest level from 1991 to 2007.

Looking at the details, Electricity, Gas and Water supply started at 3 million of tons in 1991, which was the highest level acid rain emissions of four sectors at this point, then there was a sharp decline from 1991 to 1997. Following this, the figure fluctuated from 1997 to 2001 and fell slightly to 0,5 million of tons in 2007.

If we look at Other industries and Domestic, it can be seen that these sectors had a similar trend. Having remained stable at approximately 2 millions of tons from 1991 to 1993, the number of acid rain emissions from Other industries then went down gradually, reaching around 1 million of tons in 2007. The level of acid rain emissions from domestic leveled off from 1991 to 1993 at approximately 0,5 millions of tons, after that the figure decreased slightly to under 0,5. By contrast, Transport and communication maintained the same level and just had a negligible fluctuation from 2001 to 2005.


The graph below shows UK acid rain emissions, measured in millions of tonnes, from four different sectors between 1990 and 2007

closed by
by
0 points

1 Answer

0 votes
0 votes
 
Best answer

The line graph compares and contrasts data on the changes --> wrong expression. Nó đâu phải changes đâu mà là differences của 4 sectors in the number of --> delete acid rain emissions in the UK from four different sectors, measured in millions of tons, over a seventeen-year period from 1991 to 2007.

Overall, what stands out from the graph is --> it is noticeable that transport and communication maintained the same level in the number of acid rain emissions over seventeen years, while other sectors saw a significant fall, especially Electricity, Gas and Water supply. Among the four sectors, other industries have --> had the lowest level from 1991 to 2007. *** Bạn vẫn chưa tóm gọn cả xu hướng của cả 4: đều giảm (dù thằng transport & communication nó cao lúc đầu). Đây là 1 câu tóm gọn của thầy Simon nhé: It is clear that the total amount of acid rain emissions in the UK fell considerably between 1990 and 2007. 

Looking at the details, Electricity, Gas and Water supply With respect to Electricity, Gas and Water supply, their emissions started at 3 million of tons in 1991, which was the highest level acid rain emissions of --> emitting the most massive amount of acid rain in comparison with four sectors at this point, then there was a sharp decline from 1991 to 1997 --> prior to / before experiencing a downward trend throughout 2007. Following this, the figure fluctuated from 1997 to 2001 and fell slightly to 0,5 million of tons in 2007.


If we look at In terms of Other industries and Domestic, it can be seen that emissions from these sectors had a similar trend were on an downward trajectory during the given period. Having remained stable stabilized at approximately 2 millions of tons from 1991 to 1993, the number --> amount of acid rain emissions from Other industries then went down gradually, reaching around 1 million of tons in 2007. The level of acid rain emissions from domestic --> The amount of acid rain came from Domestic leveled off from 1991 to 1993 at approximately 0,5 millions of tons --> remained stable at 0.5 from 1991 to 1993 after that the figure decreased slightly before dropping to under 0,5 --> to about 0.3 in 2007. By contrast, Transport and communication maintained the same level and just had a negligible fluctuation from 2001 to 2005.

***nhìn chung thì grammar bạn khá tốt, chỉ có sai một lỗi nhỏ nhỏ thôi. Ráng hạn chế nhé!!!. Có một vài phrases bạn sử dụng nó khá là thừa nên cũng cần cân nhắc kĩ trước khi mang vào bài nhé. Bạn có thể tìm bài mẫu của thầy SIMON với tựa bài này để tham khảo nhé. ***

selected by
by
135 points

3 Comments

*** CHO MÌNH BỔ SUNG NHÉ, Ở CÂU ĐẦU BẠN CÓ THỂ DÙNG "CHANGES" NHÉ ***. DO MÌNH ĐỌC KHÔNG KĨ NÊN CÓ SAI SÓT CHO MÌNH THÔNG CẢM.
Bài chữa khá tốt ạ, bài chữa đã được chọn.

bạn vui lòng gửi stk hoặc sdt về email James[at]scholarshipplanet.info để nhận phần quà từ CWMP VIP nhé ^^

Dạ em cảm ơn ạ. Em xin confirm là em đã gửi mail rồi đó ạ. 

Related questions